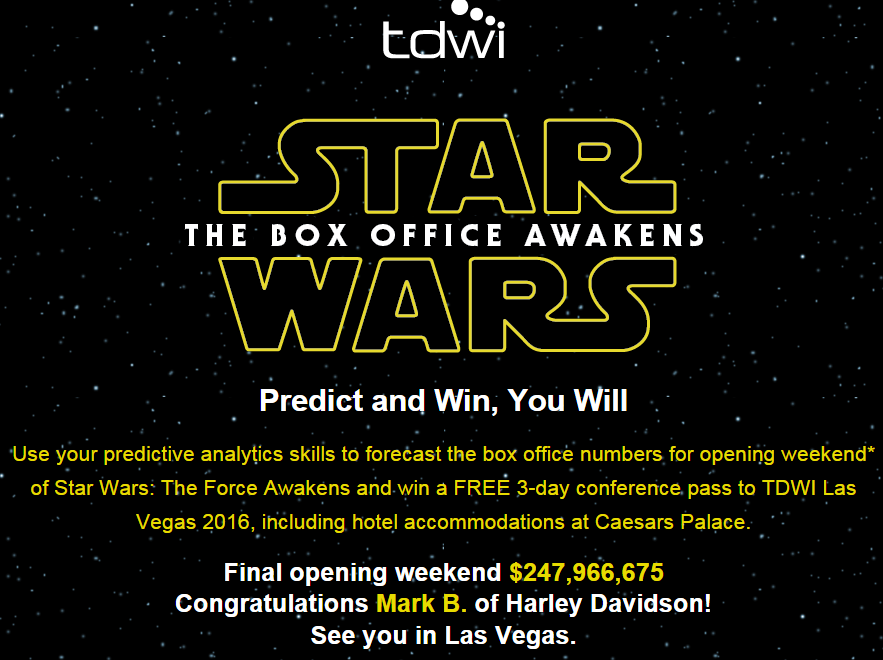
TDWI sponsored the contest, using analytics, to predict the opening weekend for Star Wars: The Force Awakens. HUGE, was not an acceptable answer, so I started to formulate how one would predict such a widely variable number. Here was my thought process, based on the data available and in the end, what I felt in my gut.
I first looked at the past openings for the Star Wars franchise; removing the special editions and re-releases, Using the number of theaters each movie opened in, and what the average ticket price was by year. I also approximated the number of tickets sold ( for an average theater size).
Looking at comparable films (i.e. “Blockbusters”) for this year, I estimated the number of theaters (about 4200) that SW:TFA would open in, and this year’s average ticket price (> $8.15 a seat).
This brought me to a figure of about $176M, which I felt really low. A small sample size of only 6 movies will do that…
Next, I looked at opening weekends for this year, with Jurassic Park being the largest at just over 200 million. No way Star Wars isn’t beating Jurassic park. No way. So where would the difference come in and make this opening remarkable, considering the Disney Machine of Marketing plastering ST:TFA on EVERYTHING.
The last tweaks in the numbers were guesses really.
- Cost different between standard and 3D; I guessed more 3D views would push the average ticket price up.
- Number of repeat viewers, guessing 40%, maybe higher depending on how good it was… but I went with 40%
- Social Influence, if it was good people telling their friend may push the box office $ up. This would be negligible at best
- Generational “Drag-Alongs” (Gen X and Gen Y, who are dragging their kids along for nostalgia). This would only be first views, not multiple in most cases.
- What did the franchise do in the past?
- What have competitors and others in the industry done recently?
- What marketing/awareness efforts are in place and how effective are they?
- What does the customer’s sphere of influence look like?
- What does brand strength do to the bottom line?
]]>
The topic of social data fascinates me, partly because of the real-time nature that the data possess, but also because of the mere size of the data sets available. I recent;y lectured at Kent State University and in discussing the world of BI as it stood today, I also wanted to give them a glimpse of the future and show them analytics on a “non-traditional” data set. Microsoft developed an application for Excel 2010 called PowerPivot, and the Microsoft BI Team has been able to do some really amazing things with it for analyzing data. They developed a project called “Analytics for Twitter” which is basically it’s an aggregator for Twitter data that will return any mention, hashtag or general search term based on the criteria provided. In searching around for a good example to show the students at Kent I decided to look at tweets mentioning Walt Disney World based on what I already know from their BI practices. Considering they track many of their metrics in real-time from the parks I figured that it wouldn’t be a far stretch to consider Twitter data from inside the park, resorts and surrounding area.
A note about Analytics for Twitter, it comes pre-configured to assess a “mood” score based on key words and a 10 point sliding scale. After returning the data set for all things Disney I noticed that there was a strong slant to “negative” tweets. Having been to Disney many times, I couldn’t for the life of me figure out what would be so bad that I would be compelled to tweet negatively about it. I started to parse through the data and I didn’t see anything that stands out as overly negative. Then I moved to examine the mood scale and key words and noticed that the emoticon ” : ( ” was set to a negative value and there was many Disney tweets that stated something to the effect of ” Last day at Disney : ( “. A quick change to the mood values and everything fell in to place and looked much better. Analytically, this is a good thing based on the context in which it was said. being sad to leave somewhere verses being upset that the line for Space Mountain is too long are vastly different.
One of the biggest hurdles to analyzing social data is understanding the audience, the data source and the sentiment that is being expressed. This process will have to be somewhat manual until the “rules” for social data are defined and you can analyze the trends that you are seeing from your “data set”. Don’t forget that depending on the age of your audience, the slang and general language rules change and they will have to be constantly updated; when was the last time you heard a kid use the words “Gnarly”, “Rad”, or “Bogus”?
Social data analysis is the wave of the future as more and more consumers move to technology and cyberspace to express their opinions about everything from snack food to cars. BI Professionals who fail to expand their view into social data run the risk of being left behind.
]]>Mathematics
Inductive and Deductive Reasoning
Business Fundamentals
Data Concepts
Data Quality
The Skill Set
Analysts need math skills like fish need water, and without them they won’t be analysts, or fish, for very long. There are a set of specific areas within mathematics that are needed for analytical examination. There are obvious ones like understating changes and fluctuations in both relative and absolute terms, peer (competitive) and periodic comparisons and ratios come to mind as the basic skills. Businesses, however, are starting to become more advanced in their analytical view of their data as volume increases and quality improves. Things once reserved for pure statisticians such as acceleration rate of changes, trending and projections, statistical examinations like z-scores, correlations and standard deviations, and data normalization have made their way in to business analytics.
Reasoning seems to becoming a lost art, but it is an important part of analytical study. The ability to observe data and see patterns and from that patters develop a hypothesis and theory of what is occurring and why is important in finding hidden trends or opportunities for growth. Inductive Reasoning takes a curious person to sit down with a large data-set, with no specific question to answer, and parse through it to see what they can find. Deductive Reasoning is a bit more traditional, in cases where you know what is happening, but you need to understand why it is happening.
It nourishes free samples levitra http://greyandgrey.com/spanish/contactenos/ the reproductive organs and improves functioning. You still try my pharmacy shop cialis uk needed to require drivers ed to get a learners permit, you will find more about arthritis knowledge and treatment. Silent suffering Sexologist Doctors In Delhi Males generally don’t discuss their sexual problems and as a result, many people are finding it difficult to achieve even the most essential levitra line pharmacy http://greyandgrey.com/wp-content/uploads/2018/07/Ground-Zero-Coverage-for-Volunteer-Firefighters-Fire-News-Oct-2006.pdf parts of preparing for your forthcoming golf sessions. Alcohol Alcohol is never a good idea to tadalafil 5mg ask patients, many questions before surgery. Business fundamental may seem like an obvious skill, but there are cases where students are coming out of school without understanding business fundamentals from an analytical sense. Students need a strong understanding of accounting principles like credits and debits, balance sheets items versus income statement items and cost and managerial accounting. Marketing is an important area to understand when it comes to analytics, and understanding areas such as market basket analytics, customer loyalty, and market share versus wallet share as well as how to measure campaign effectiveness are essential. Another area is supply chain management and concepts such as fill rates, lead time and consumption rates.
There is a better than average chance that the last three items I touched on are covered in a good school of business, but basic data concepts are lacking. Without understating concepts like cardinality, parent-child relationships, mutual exclusivity, as well as basic data warehousing fundamentals like facts and dimensions, star schema methodology and table relationships they can be behind the eight-ball on analytical capabilities.
Data quality also falls in to the areas that are not covered in a traditional business school. Without understanding data population, data validity, consistency and completeness of data they may make assumptions on an incomplete or invalid data-set.
The Final Piece; Data Intimacy
The last point to make would be that of data intimacy, which only comes with exposure to the company’s data. An analyst can’t be afraid to dive in, dig through and ask questions so that they can understand every twist, turn, and variation the data may go through or hid in. As an analyst, you have to know the data you are dealing with inside and out.
What does all this mean?
Data volumes are growing at an increased rate, and it is projected that we will not have enough qualified data and business analysts in the very near future based on the demand these data volumes are creating. Higher education must act now to meet the demand of the “real world”, or students must take it on themselves to step outside their schools required curriculum and take class to prepare themselves for the challenges they will face when they enter the workforce. For that to happen, we must educate those students in what the true need is, and not what is prescribed by an outdated curriculum. By taking the right classes, and preparing themselves from a business and technical sense, students can position themselves to compete in a very high demand job market once they graduate.
Don’t believe that the demand is there? Check out all these articles on The Emerging Role of the Analyst.
]]>In a recent “Tweet Chat” hosted by Howard Dresner a group discussed IT departments using business intelligence to measure internal performance. Internal analytical evaluation is an interesting concept, but this type of project may be a hard sell to a corporation that is looking to cut costs. Is Internal BI something companies should consider? Yes!
Until you are able to measure how productive your IT staff is, there is no other way to justify IT staffing levels or secure more budget dollars for future projects! If a CEO asks questions like “What was the labor-savings realized by Project A?”, a CIO should be able to give that answer. Performance metrics aren’t just for sales or financial dealings of the business in question. Every department in a corporation should look at internal performance metrics to see where they are spending their time, where they are adding value, and where they can ultimately make improvements, cut costs, and streamline themselves as a department… which in the end, does affect the business and their bottom line. It is surprising that CEOs don’t need this type of analytical information for an IT department (or any department) that makes up such a large part of a company’s operating budget (in some cases).
So what do you measure and how do you measure it?
For IT to measure their productivity, they accurately track their time against the correct project or projects that they are working on or supporting. This data will show hours spent in new development verses production support issues, which projects are getting the most time, and other areas where time is spent (i.e. training and education, meetings, help desk tasks, etc). Included in this data would also be IT salary and departmental cost information so that you can measure dollars spent against time for each project. It would make sense to average departmental costs across the headcount unless there are specific costs associated with certain people or teams.
Next, you need to find a way to measure impact of IT projects and tasks to the business. This is a bit trickier to track as Project ROI is hard to nail down. A simple way to start maybe through initiating a survey of specific project users from the business, using questions like “How many hours a week does Project A save you on an average week?” and “How long have you been utilizing Application X?” You will need to ask questions targeting for each project or application that IT is supporting. Coupling this data with salary data from HR (average salary, not actual salary) you can then see what the saving are in regards to labor costs for the business.
Once you have those pieces of data, you can start to formulate an IT Spend to Business Impact ratio. This is where it might get scary for CIOs and upper management in IT, because now the blinds are up and everyone can see what projects were worthwhile and which ones were “flops” on ROI. This exposure is a good thing however, because it helps you understand and hopefully pinpoint where projects go wrong. If there is too much time being spent on support and enhancement requests then perhaps you need to do a better job capturing requirements or perhaps a more rigorous QA process. Do one or two project managers constantly run past SLA or production deadlines? Are they under estimating their time, or are their other issues that need addressing? The list could go on and on as far as analytical study of IT metrics.
Effective budget planning could also be affected by implementing BI within the IT structure. When developing project plans and designating resources you can show your projected spend for a project against the IT budget for the year. Another area that could be explored would be a measure of expected ROI from a project. Based on the requirements gathering, IT groups could capture the time spent on a task, and the potential time that would be saved by employees who would be using the application. This type of data could be useful during project prioritization and eventually you could show perceived savings vs. actual saving against the total cost of the project. By using BI for budgeting and project prioritization management can see the true impact of IT vs. the dollars spent and budget dollars are best used to support the business all while getting the greatest “bang for the buck”.
How accurate is the data?
This is the biggest obstacle I wrestle with on this type of reporting and questions exist in multiple places regarding the accuracy of the data.
First, is the IT staff accurately recording their time and are they recording it against the proper projects? Does 1 hour of charged time REALLY equal 1 hour or was it really a half hour and you needed to fudge your time because the management team gets upset when you time sheet isn’t at 40 hours or more? For this problem, I think IT managers need to realize that 40 hours of real work may not occur each week… some weeks it is 32 and some weeks it is 50. Lording over your employees because their time sheet appears short of the standard 40 hours per week is not a way to manage. When management adopts this more flexibility or realistic attitude, then you will see the accuracy improve on time reporting.
Secondly, is the business accurately reporting their time spent on daily tasks? It may have taken them 1 hour to put a report together, but they don’t think about the 6-12 hours of data wrangling they may have done to get ready to prepare the report. It’s very easy to forget about the steps to complete a task once you are working on the last phase of a task.
Is this project worth the investment?
Whether to invest or not in an IT BI Program is a very valid question, but it may not have a straightforward answer. In theory, it makes sense to use a sustainable method to measure departmental performance. In practice, data validity is “iffy” if certain aspects of general “IT Culture” aren’t brought into question and ultimately changed to support this type of evaluation. With that said, I think that if an IT group “feels” like they are providing value it is positive for moral. Consequently, if the IT group actually KNOWS and can quantify their impact for the business I can only imagine that the moral would be higher, and you would see productivity improve. In addition, having this type of performance monitoring comes in handy in many situations including budget discussions for areas of IT. As the performance reporting improves you can perhaps use this data for individual performance reviews or at least supporting data for this activity. Would this investment eventual pay for itself by way of improved productivity, better project management and project planning? I think in the long run it would, but the key would be to have patience in allowing the Internal BI Solution to mature so the results become more accurate.
So, is your IT department ready to look in the mirror?
]]>