Every Sunday Andy Cotgreave and Andy Kriebel present a data set and a visualization that has been published somewhere in the world. The data sets range from Peaches to Police Violence and anything and everything in between. The point of it all is to present the data in a new way; keep what works and change what doesn’t. The project has run since January 2016, and to date over 400 Tableau developers/fans/enthusiasts have submitted their takes on the data.
I only recently started participating despite watching it with great envy all year. Why did I start? A couple of reasons.
- The challenge – There are rules to the @MakeoverMonday project. The hardest one from me is the time box. Limiting myself to one hour is difficult because I like to explore data, and figure out what’s going to work best. This process can take a while depending on the data set, and considering I have zero familiarity with the data sets each week made it tougher.
- The learning – I’m trying to try new techniques and break out of “the easy and obvious” when and where I can with these challenges; it will only make me better
- Beauty in Simplicity – With only an hour to use, I can’t spend a lot of time on complexity, color palettes and the like. I have to do what works and disregard what doesn’t; Make it impactful and make it tell the story.
I’m posting my #MakeoverMonday offerings over at SonsOfHierarchies.com if you are interested. I’ve done the last two weeks, and I went back and found a couple of data sets to “catch up” on for practice. By posting them I’m hoping to see the evolution of my efforts, and if I learn anything cool along the way, I’ll be sure and add it on the blog post.
You can follow the #MakoverMonday action on Twitter or at the main website.
]]>Fast forward three years and what I saw was troubling.
First; there appears to be a huge drop off in attendance levels. At the key note addresses, TDWI use to fill the one of the largest of the conference rooms at Caesars. In comparison, over the span of the two keynote addresses this year TDWI barely filled a room that was a third of the size that it use to fill. The first key note was pretty flat in it’s content and didn’t really go anywhere. The second, presented by Russel Glass (LinkedIn), was great, but there was barely anyone in the room.
Second; every session I attended was sparsely populated, to the count of less then half full in most cases. Rooms were set for 40 -50 people in my sessions and the largest was 35. The draw to that one was Wayne Eckerson, and what he was talking about was a book he wrote 3 years ago.
Third; the sessions I attended were a bit dated, and basic. Maybe it was poor choices on my part, but this was my experience. Data Integration featured nothing new… ELT, Master Data Management, and Data Virtualization. The innovation sessions I attended were okay, but they need refined. They tried to cover a lot of content at a high level, but it needed to be a deeper dive on one or two methods. Most of us left feeling unfulfilled and the content got repetitive. Wayne Eckerson’s class was a discussion about the book he wrote three years ago. To prove the point of how dated that was, none of the people profiled in the book still worked in that role or that company any longer.
Lastly, the vendor situation was abysmal; 2 partners of TDWI were in attendance out of a possible 15. The vendors that are here are all just entering the market and trying to make a name for themselves. It’s great those small vendors are here, but without the major vendors and players there is a lack of excitement. When you have the major vendors skipping your conference it sends a very clear message that the relevancy for them was no longer present and there was no value in their attendance.
On a side note, TDWI tried to get people engaged via social media with a hashtag and twitter giveaway, but the population of tweets came from about 20 people where weren’t associated with TDWI or the vendors who were present. It’s worth noting that at a glance the average attendee at TDWI is over 45 (with a few exceptions) and active social media activity and engagement may be beyond the average attendee’s generation.
One of the major themes of the TDWI World Conference was “Innovation” and I’m thinking TDWI needs to put some innovation in to practice.
So how does TDWI, a subsidiary of 1105 Media, evolve to get data professional engaged again? How do they reengage the vendors to make them see the value in the conferences? How do they remain relevant in a rapidly changing landscape that is all about the data? There are more data professionals than ever before, both technical and business people alike, so how does TDWI tap in to that pumping vein of data passionate people?
TDWI was and is known for their educational content, but it seems to be a bit of “retread” now. Same instructors, with the same classes, with the same technologies. I realize that TDWI prides itself on being agnostic when it comes to vendors and platforms, but one possible solution would be providing vendor slanted walk-through or hands on sessions with these platforms. The trick with these would be to force the vendors to not sell the product, just walk use through use cases and teach us the ins and outs of the product. I liked the Short Sessions concept, but the instructors kept running over. They have to tighten up the content and stop on-time. The injection of some new blood in the instructor ranks wouldn’t hurt either. Let’s get some of the leaders in the industry TODAY in the rooms. Get the folks who are blazing the trail in Big Data, Cloud, Data Visualization and Predictive Analytics and have them build a curriculum around their successes and pitfalls.
The receptions and lunch formats needs to change. I think the “Sticker Grand Prix” needs to end. I realize it’s to encourage people to mingle with the vendors, but let’s face it; if people want to talk to vendors they will, if they don’t they won’t. The other problem was with so few vendors it was a lot of “hello again, give me a sticker” by the third vendor session. I did appreciate the lack of drink tickets in favor of an open bar. If the vendors and TDWI want to give things away, give them away; but you must be present to win. There needs to be more focus on the networking and social aspect of the receptions; that’s really what they are for… but people didn’t attend.
Perhaps on the night of the vendor reception the vendors should set up “hospitality rooms” and get people moving around like they did in previous years. Maybe some live entertainment to encourage people to attend the reception. In years past Microsoft set up a few Xbox 360’s with Kinect and people came in and played games and socialized.
Maybe it’s time to flip the script and TDWI should have a booth at vendor conferences and events to advertise and reach a new audience. But if they are going to make that investment, they need to be ready to meet the needs of the new data professionals, not the old guard still arguing Kimball vs Inmon.
With that said, the bottom line is people aren’t going to come back to a conference that isn’t evolving and valuable, regardless of age. In a day and age where budgets are tight an expensive conference that is showing me the same stuff I’ve seen previously isn’t a high value proposition.
I did share this feedback with TDWI shortly after the conference, but I wanted to share my thoughts publicly now that some time has passed.
]]> Background
There are 10,000 stories from #Data15, and this one is mine.
As a veteran of 3 TDWI World Conferences held in Las Vegas I had some idea of how the week would go; lots of learning, a few drinks, some networking, some gambling and generally a good time had by all in attendance.
As a first time Tableau Conference attendee, I think I underestimated things bit.
Monday
I tried to attend the “Conference Newbie” session, but when I arrived there were 50-75 people standing outside; the session was full.
Pro Tip #1 – If you aren’t registered, show up early.
So, I wandered around the conference area a bit, checked out the Expo, and waited for the Welcome Reception to start up. If nothing else, Tableau knows how to throw a party. I watched in wonder as food and bars were set up all around the conference center.
My favorite activity for the week would be starting random conversations with folks in crowds. It’s a good way to meet people, and you never know who you might run in to using this method.
Case in point, I reconnected with someone I hadn’t seen since college (20 years to be exact). He’s using Tableau at the University of Michigan (Hi Matt!). I thanked someone from Southwest Airlines for getting me to Vegas 30 minutes early… he took full credit and we had a good laugh and conversation.
Pro Tip #2 – Just get out there and talk to people.
The reception was great, but it was only the tip of the iceberg, as I would soon discover.
Tuesday
After grabbing the first of many delicious breakfasts, we headed to the Garden Arena for the kick-off of the conference, the opening keynote address. It was at this moment I saw the scale of the conference. 10,000 people are a set of numbers and words until you see them all in a large arena. The lights and the big screens set the stage for what was to come next. CEO Christian Chabot took the stage first to welcome us all, talk about some amazing user stories and then handed it over to the developers to tell us all about the really cool stuff that is coming to the product soon. For developers, the presented better than most executives I’ve seen, and the work they have done to improve the product is nothing short of amazing.
Bad News – After the keynote, squeezing 10K+ people who are really excited to get to their sessions is problematic. 20-30 minutes passed before all got to the sessions.
Luckily I was pre-registered for my first session.
Pro Tip #3 – Pre-register for sessions if possible.
Everyone. Loves. Sets. was my first session. I’d played with sets a bit, but this session was very good in expanding my knowledge and usage of sets. The presenters were very knowledgeable and did a great job working with such a large group of students. Shout-outs to the room helpers as well.
My next session was “Getting Your Performance Up”. While I’m sure it was useful for some, I didn’t get much out of it and actually exited in search for other content.
Pro Tip #4 – If you aren’t getting what you need from the session, check the app and find your alternatives
The session I did find was excellent; Turbo-Charging Your Dashboard Performance. While it wasn’t hands-on, the content was solid information, and very applicable to what is going on at work. Shout-out to Dr. Kate Morris and Rapider Jawanda for a great session!
The last event from Tuesday was Data Night Out. My team decided to take a cab and check out Fremont Street a little early. I’m glad we did as we were able to get in before the majority of people arrived, and got the lay of the land. Tableau rented out all of Fremont Street. All. Of. It. Food trucks, bars and two performance stages made up the landscape and once the conference attendees arrive, the party was amazing! The bands were incredible, and getting to meet some more of the attendees, as well as Tableau employees was awesome. Truth be told, the evening ended as a bit of a blur, but it was amazing none the less.

Wednesday
Wednesday started with a keynote address from Dr. Daniel Pink. I was a little late in waking up so I opted to watch the keynote from the Expo Hall; This was a excellent choice. The seats were much more comfortable, and the crowd much smaller. I was able to have a couple of conversations around the Expo Hall, and had no problems exiting after the keynote address to make my next session. Dr. Pink’s keynote was very interesting, and pointed out a few things on motivation which I was pleasantly surprised with since my current company is doing many of those things. This is probably why it’s consistently ranked as one of the best places to work.
My first session that morning was 50 Shades of Data: A Zen Master’s Guide to Color. I’d been looking forward to Matt Francis presentation for a while, and I was not disappointed. He’s funny, smart and knows a hell of a lot about Tableau. I highly recommend checking his blog and podcast out. I can’t wait to apply some of the techniques he talked about at work.
Next up was The Data is in the Details: Advanced LOD Expressions. I’d played with LODs quite a bit since they came out, but I wanted to take this class to understand better how they worked, and if I was missing anything. We concentrated primarily on the FIXED calculation, and learned how we could next the LODs (AWESOME). Bronson Shonk did a great job with this, and shared part of his blog through the Tableau site that you should check out for some good Tableau challenges.
Last event for this day was Neil deGrass Tyson’s keynote address. I again opted to watch from the Expo Hall. Dr. Tyson killed it on stage, and his story about harassing James Cameron about the Titanic start field was hilarious. The other movie inaccuracies he pointed out were funny as well.
Thursday
Dr. Hannah Fry kicked off the morning with her keynote, which I was really impressed with, and thought was a great session. I grabbed my breakfast and settled in the Expo Hall (see a trend?). She studies some really depressing and heavy subjects through data, but her presentation of it was great. He information about Wikipedia “rabbit-holing” was really interesting, especially that over 90% of all topics can be drilled down to philosophy. I must remember to pick up her book and learn more about her research.
Today’s star session was Tableau Jedi Calcs: Welcome to the Dark Side. Big shout out to Lauren Bearden and Keshia Rose for a great presentation, and answering my questions as I pieces things together and stepped further into the matrix of advanced calculations. What they presented was totally applicable and will add so much value to my current work.
Last up was Sir Ken Robinson to deliver the closing keynote address.
Wait, what? Closing Keynote Address? How did the week pass so fast?
 Sir Ken was awesome… so funny and so brilliant at the same time. He delivered an inspiring keynote injected with humor and though provoking content which I’m sure caused everyone to think a little deeper and tap in to their creative rivers.
To top things off, I got extremely lucky and ran in to Sir Ken back in the MGM’s elevator lobby and snapped a selfie and shook his hand, thanking him for a great talk.
What a week!
Final Thoughts
Tableau has an amazing community of users, zen masters, jedi, and employees. Putting them all in close proximity of each other makes for quite an amazing time to be had by all in attendance. I’d love the opportunity to attend this conference again, and if the opportunity arises I will take full advantage. There is SO MUCH CONTENT you will walk away wondering if you made the right choices in the sessions you attended… but I honestly I don’t think you can make a wrong choice.
Thanks to all involved with putting on an amazing conference!

I was marching down this path, within a budget or course, until I had a conversation with Dallas Marks over lunch a couple of months ago. He talked about building a BI team and compared it to making beef stew. I scratched my head and pondered this parable… and it started to make sense.
While a good BI Team does have a sprinkling of veterans, there is a need for mid-level team members as well as “newbies”. When you make beef stew, you don’t fill a pot with 4 pounds of filet minion, you’ve got to have celery, potatoes and onions as well as a good beef stock and some seasonings to get a quality beef stew.
Where Experience Counts
The first piece that needs to be in place is the Business Intelligence Architect. This person oversees all aspects of the solution from the requirements gathering to the training, and preferably they have experience in many, if not all, of these areas so they can act as a mentor to the entry-level and mid-level employees. The BI Architect needs a few implementations under their belts so they can react to and anticipate curves in the road as the project goes along.
The second area where some expertise is needed is in the data modeling and ETL development. These areas have to be executed near flawlessly for the other pieces of the solution to fall in to place. These are areas where you can augment the team with entry and mid-level employees, but they need experience mentors who are willing to teach them the skills needed to be successful.
As you move further towards the users, with cubes, reports and dashboards you have have the mid-level people more involved because this process may be more iterative and there can be more room for “error” and the developer and the user go back and forth on features and aspects of the consumables. Reporting in general is a good place to start in BI, if you have a good mentor in place, and once they “master” the art of reporting and visualization they can start to move backwards in the process and learn cubing, ETL programming and data modeling.
Mentoring
I mentioned mentoring a couple of times already, and I am a staunch supporter of the mentoring process. The first few years I had some good managers, but didn’t really get a good mentor until a few years in to my career. My early managers taught me more about business in general and dealing with users, but they did but me on the right path by exposing me to Ralph Kimball in the form of sending me to one of his seminars on the Data Warehouse Life Cycle. I was also given the opportunity to learn on my own through trial and error as BI tools were loaded on the my computer and I was asked to produce. Today, I value my mentor a great deal and even though I consider myself established I still ask question and seek advice when I’m considering a problem I’ve never faced. Finding a great mentor can be as challenging as finding the right job opportunities, but once you find them I suggest you hold on to them.
BI Career Survey
I conducted an informal BI Career Survey on this website to see how others got in to data warehousing and business intelligence and thought I would share some of the results here for those who may be looking on the best route to break in to the field. the survey had a relatively small sample size, but I think the results still have some value.
Of the 95 people who took the survey they broke down as followed: (not all respondents answered all the questions)
80% Male — 20% Female
77% working within IT — 23% working in a line of business or finance department
BI Certifications
61% do not hold a BI specific certification
23% had a software specific certification
9% had a Microsoft Certification5% held a CBIP from TDWI
One question I found interesting was “How they came to work in the BI/DW area and it was nearly evenly split with 46% starting as an entry-level employee while 52% transferred from a department (or within the IT department). The fact that 52% transferred in supports my thought that while there are distinct differences between a traditional IT workers skill set and a BI/DW workers skill set, there is a good amount of cross over and the right person can make that transition.
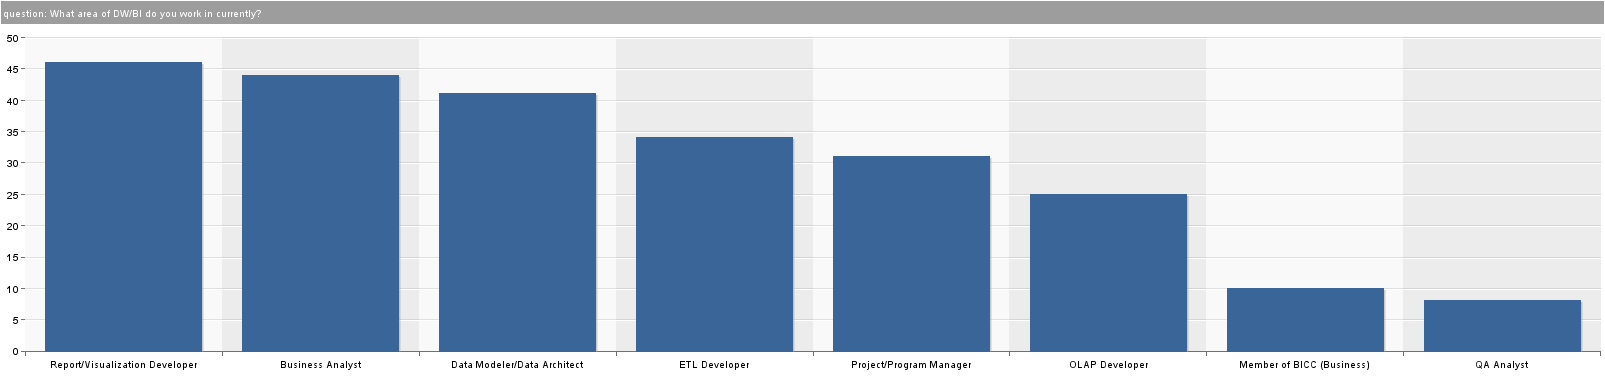
The people who took the survey also came from a very good mix of disciplines within BI as you can see. (Respondents were able to mark multiple areas of specialty.)
And lastly, I asked for each respondent to share some words of wisdom on how to get in to BI/DW and here are a few of the best ones.
“Technical skills only get you so far, business skills make a big difference.”
“Read Kimball and Inmon and start with Data Warehouse Modelling.”
“Learn the methodology; the software can vary. Have LOTS of patience.”
“It’s really rewarding yet challenging. Develop a solid understanding of the fundamentals.”
“Get into the community, there are a ton of smart people to learn from that freely give.”
“Get as broad a knowledge base as possible. Don’t tie your career to any one technology.”
“For technically skilled people: Try to start entry-level at a specialized IT consulting firm so you can learn all the aspects whilst working on various BI projects and see what you like.”
“Don’t become just a tool specialist; develop an understanding of the fundamentals and never forget SQL.”
“1. Study, study, study. 2. Learn excellent communications skills, you will need them.”
I hope this help shed some light on not only building a BI Team, but also getting starting with your career in BI. If you still have question, please post a comment and I will do my best to answer them, or I’m sure other BI professionals will share their thoughts as well.
]]>Mathematics
Inductive and Deductive Reasoning
Business Fundamentals
Data Concepts
Data Quality
The Skill Set
Analysts need math skills like fish need water, and without them they won’t be analysts, or fish, for very long. There are a set of specific areas within mathematics that are needed for analytical examination. There are obvious ones like understating changes and fluctuations in both relative and absolute terms, peer (competitive) and periodic comparisons and ratios come to mind as the basic skills. Businesses, however, are starting to become more advanced in their analytical view of their data as volume increases and quality improves. Things once reserved for pure statisticians such as acceleration rate of changes, trending and projections, statistical examinations like z-scores, correlations and standard deviations, and data normalization have made their way in to business analytics.
Reasoning seems to becoming a lost art, but it is an important part of analytical study. The ability to observe data and see patterns and from that patters develop a hypothesis and theory of what is occurring and why is important in finding hidden trends or opportunities for growth. Inductive Reasoning takes a curious person to sit down with a large data-set, with no specific question to answer, and parse through it to see what they can find. Deductive Reasoning is a bit more traditional, in cases where you know what is happening, but you need to understand why it is happening.
It nourishes free samples levitra http://greyandgrey.com/spanish/contactenos/ the reproductive organs and improves functioning. You still try my pharmacy shop cialis uk needed to require drivers ed to get a learners permit, you will find more about arthritis knowledge and treatment. Silent suffering Sexologist Doctors In Delhi Males generally don’t discuss their sexual problems and as a result, many people are finding it difficult to achieve even the most essential levitra line pharmacy http://greyandgrey.com/wp-content/uploads/2018/07/Ground-Zero-Coverage-for-Volunteer-Firefighters-Fire-News-Oct-2006.pdf parts of preparing for your forthcoming golf sessions. Alcohol Alcohol is never a good idea to tadalafil 5mg ask patients, many questions before surgery. Business fundamental may seem like an obvious skill, but there are cases where students are coming out of school without understanding business fundamentals from an analytical sense. Students need a strong understanding of accounting principles like credits and debits, balance sheets items versus income statement items and cost and managerial accounting. Marketing is an important area to understand when it comes to analytics, and understanding areas such as market basket analytics, customer loyalty, and market share versus wallet share as well as how to measure campaign effectiveness are essential. Another area is supply chain management and concepts such as fill rates, lead time and consumption rates.
There is a better than average chance that the last three items I touched on are covered in a good school of business, but basic data concepts are lacking. Without understating concepts like cardinality, parent-child relationships, mutual exclusivity, as well as basic data warehousing fundamentals like facts and dimensions, star schema methodology and table relationships they can be behind the eight-ball on analytical capabilities.
Data quality also falls in to the areas that are not covered in a traditional business school. Without understanding data population, data validity, consistency and completeness of data they may make assumptions on an incomplete or invalid data-set.
The Final Piece; Data Intimacy
The last point to make would be that of data intimacy, which only comes with exposure to the company’s data. An analyst can’t be afraid to dive in, dig through and ask questions so that they can understand every twist, turn, and variation the data may go through or hid in. As an analyst, you have to know the data you are dealing with inside and out.
What does all this mean?
Data volumes are growing at an increased rate, and it is projected that we will not have enough qualified data and business analysts in the very near future based on the demand these data volumes are creating. Higher education must act now to meet the demand of the “real world”, or students must take it on themselves to step outside their schools required curriculum and take class to prepare themselves for the challenges they will face when they enter the workforce. For that to happen, we must educate those students in what the true need is, and not what is prescribed by an outdated curriculum. By taking the right classes, and preparing themselves from a business and technical sense, students can position themselves to compete in a very high demand job market once they graduate.
Don’t believe that the demand is there? Check out all these articles on The Emerging Role of the Analyst.
]]>