There are 10,000 stories from #Data15, and this one is mine.
As a veteran of 3 TDWI World Conferences held in Las Vegas I had some idea of how the week would go; lots of learning, a few drinks, some networking, some gambling and generally a good time had by all in attendance.
As a first time Tableau Conference attendee, I think I underestimated things bit.
Monday
I tried to attend the “Conference Newbie” session, but when I arrived there were 50-75 people standing outside; the session was full.
Pro Tip #1 – If you aren’t registered, show up early.
So, I wandered around the conference area a bit, checked out the Expo, and waited for the Welcome Reception to start up. If nothing else, Tableau knows how to throw a party. I watched in wonder as food and bars were set up all around the conference center.
My favorite activity for the week would be starting random conversations with folks in crowds. It’s a good way to meet people, and you never know who you might run in to using this method.
Case in point, I reconnected with someone I hadn’t seen since college (20 years to be exact). He’s using Tableau at the University of Michigan (Hi Matt!). I thanked someone from Southwest Airlines for getting me to Vegas 30 minutes early… he took full credit and we had a good laugh and conversation.
Pro Tip #2 – Just get out there and talk to people.
The reception was great, but it was only the tip of the iceberg, as I would soon discover.
Tuesday
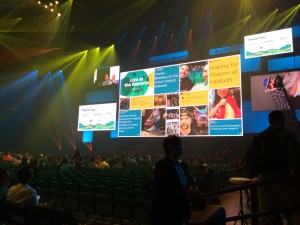
After grabbing the first of many delicious breakfasts, we headed to the Garden Arena for the kick-off of the conference, the opening keynote address. It was at this moment I saw the scale of the conference. 10,000 people are a set of numbers and words until you see them all in a large arena. The lights and the big screens set the stage for what was to come next. CEO Christian Chabot took the stage first to welcome us all, talk about some amazing user stories and then handed it over to the developers to tell us all about the really cool stuff that is coming to the product soon. For developers, the presented better than most executives I’ve seen, and the work they have done to improve the product is nothing short of amazing.
Bad News – After the keynote, squeezing 10K+ people who are really excited to get to their sessions is problematic. 20-30 minutes passed before all got to the sessions.
Luckily I was pre-registered for my first session.
Pro Tip #3 – Pre-register for sessions if possible.
Everyone. Loves. Sets. was my first session. I’d played with sets a bit, but this session was very good in expanding my knowledge and usage of sets. The presenters were very knowledgeable and did a great job working with such a large group of students. Shout-outs to the room helpers as well.
My next session was “Getting Your Performance Up”. While I’m sure it was useful for some, I didn’t get much out of it and actually exited in search for other content.
Pro Tip #4 – If you aren’t getting what you need from the session, check the app and find your alternatives
The session I did find was excellent; Turbo-Charging Your Dashboard Performance. While it wasn’t hands-on, the content was solid information, and very applicable to what is going on at work. Shout-out to Dr. Kate Morris and Rapider Jawanda for a great session!
The last event from Tuesday was Data Night Out. My team decided to take a cab and check out Fremont Street a little early. I’m glad we did as we were able to get in before the majority of people arrived, and got the lay of the land. Tableau rented out all of Fremont Street. All. Of. It. Food trucks, bars and two performance stages made up the landscape and once the conference attendees arrive, the party was amazing! The bands were incredible, and getting to meet some more of the attendees, as well as Tableau employees was awesome. Truth be told, the evening ended as a bit of a blur, but it was amazing none the less.
Wednesday
Wednesday started with a keynote address from Dr. Daniel Pink. I was a little late in waking up so I opted to watch the keynote from the Expo Hall; This was a excellent choice. The seats were much more comfortable, and the crowd much smaller. I was able to have a couple of conversations around the Expo Hall, and had no problems exiting after the keynote address to make my next session. Dr. Pink’s keynote was very interesting, and pointed out a few things on motivation which I was pleasantly surprised with since my current company is doing many of those things. This is probably why it’s consistently ranked as one of the best places to work.
My first session that morning was 50 Shades of Data: A Zen Master’s Guide to Color. I’d been looking forward to Matt Francis presentation for a while, and I was not disappointed. He’s funny, smart and knows a hell of a lot about Tableau. I highly recommend checking his blog and podcast out. I can’t wait to apply some of the techniques he talked about at work.
Next up was The Data is in the Details: Advanced LOD Expressions. I’d played with LODs quite a bit since they came out, but I wanted to take this class to understand better how they worked, and if I was missing anything. We concentrated primarily on the FIXED calculation, and learned how we could next the LODs (AWESOME). Bronson Shonk did a great job with this, and shared part of his blog through the Tableau site that you should check out for some good Tableau challenges.
Last event for this day was Neil deGrass Tyson’s keynote address. I again opted to watch from the Expo Hall. Dr. Tyson killed it on stage, and his story about harassing James Cameron about the Titanic start field was hilarious. The other movie inaccuracies he pointed out were funny as well.
Thursday
Dr. Hannah Fry kicked off the morning with her keynote, which I was really impressed with, and thought was a great session. I grabbed my breakfast and settled in the Expo Hall (see a trend?). She studies some really depressing and heavy subjects through data, but her presentation of it was great. He information about Wikipedia “rabbit-holing” was really interesting, especially that over 90% of all topics can be drilled down to philosophy. I must remember to pick up her book and learn more about her research.
Today’s star session was Tableau Jedi Calcs: Welcome to the Dark Side. Big shout out to Lauren Bearden and Keshia Rose for a great presentation, and answering my questions as I pieces things together and stepped further into the matrix of advanced calculations. What they presented was totally applicable and will add so much value to my current work.
Last up was Sir Ken Robinson to deliver the closing keynote address.
Wait, what? Closing Keynote Address? How did the week pass so fast?
 Sir Ken was awesome… so funny and so brilliant at the same time. He delivered an inspiring keynote injected with humor and though provoking content which I’m sure caused everyone to think a little deeper and tap in to their creative rivers.
To top things off, I got extremely lucky and ran in to Sir Ken back in the MGM’s elevator lobby and snapped a selfie and shook his hand, thanking him for a great talk.
What a week!
Final Thoughts
Tableau has an amazing community of users, zen masters, jedi, and employees. Putting them all in close proximity of each other makes for quite an amazing time to be had by all in attendance. I’d love the opportunity to attend this conference again, and if the opportunity arises I will take full advantage. There is SO MUCH CONTENT you will walk away wondering if you made the right choices in the sessions you attended… but I honestly I don’t think you can make a wrong choice.
Thanks to all involved with putting on an amazing conference!


